
In this second part we will send the angular rates to Matlab and plot them. Just to get an idea of what’s going on.
Serial Plotter with Matlab
- Connect to the Arduino
- Ask for data
- Plot angular rate data
- Roll the Plot!
We’ve seen a basic Matlab-Arduino serial communication here.
Fair enough, Let’s rock.
Matlab script
userk@dopamine:~$  sudo rm /dev/ttyS101
userk@dopamine:~$  sudo ln -s /dev/PORT /dev/ttyS101
With the following code the script will ask us the desired samplerate.
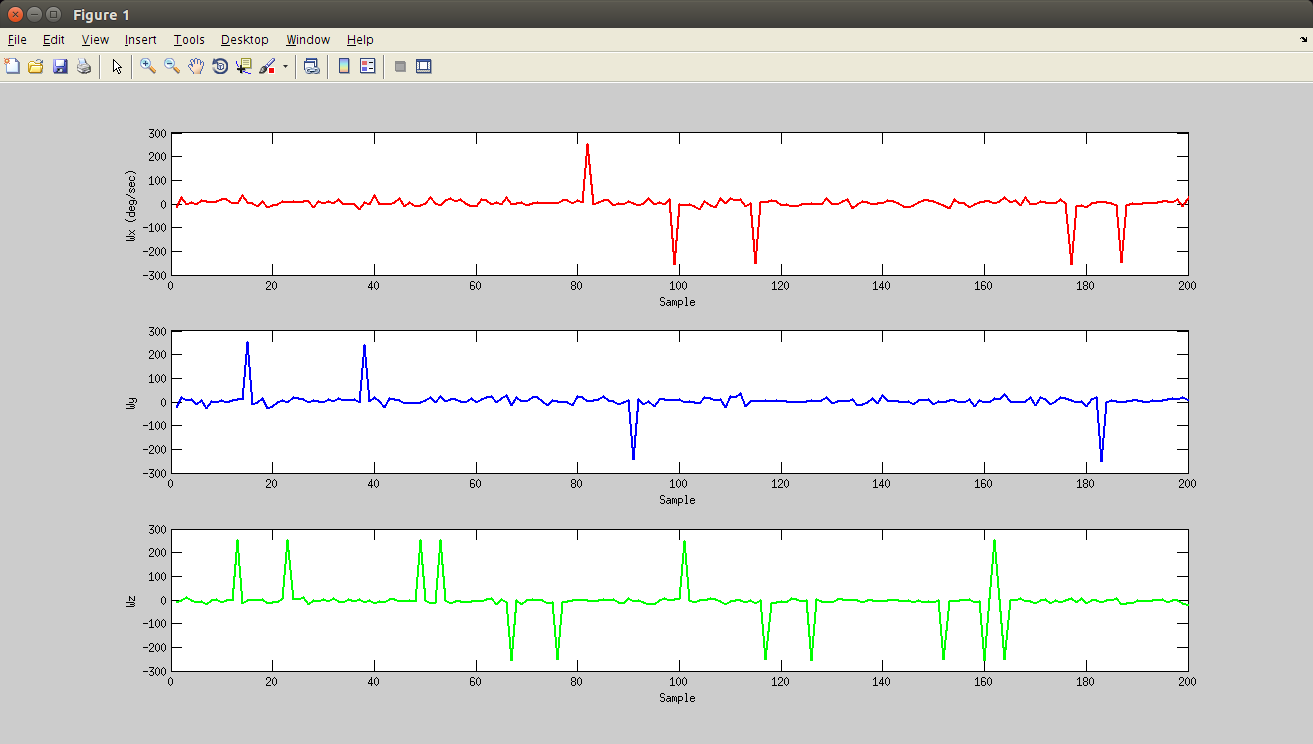
Initialize the rolling plot with a 100 samples long buffer.
Please note that in the Arduino code we were using the ‘A’ character as the message header. Let’s use this as a weak validity check. Create a while loop in which we will ask Arduino to send us the angular rates we are looking for. Use the exit condition to catch a really fast velocity value to stop the program instead of pressing CTRL + C.
Now that we are “sure” that we are dealing with our message containing the angular rates, we can scan the received string, extract the information, fill the buffer and create 3 subplots.
Done! We have our flawless rolling plot setup.